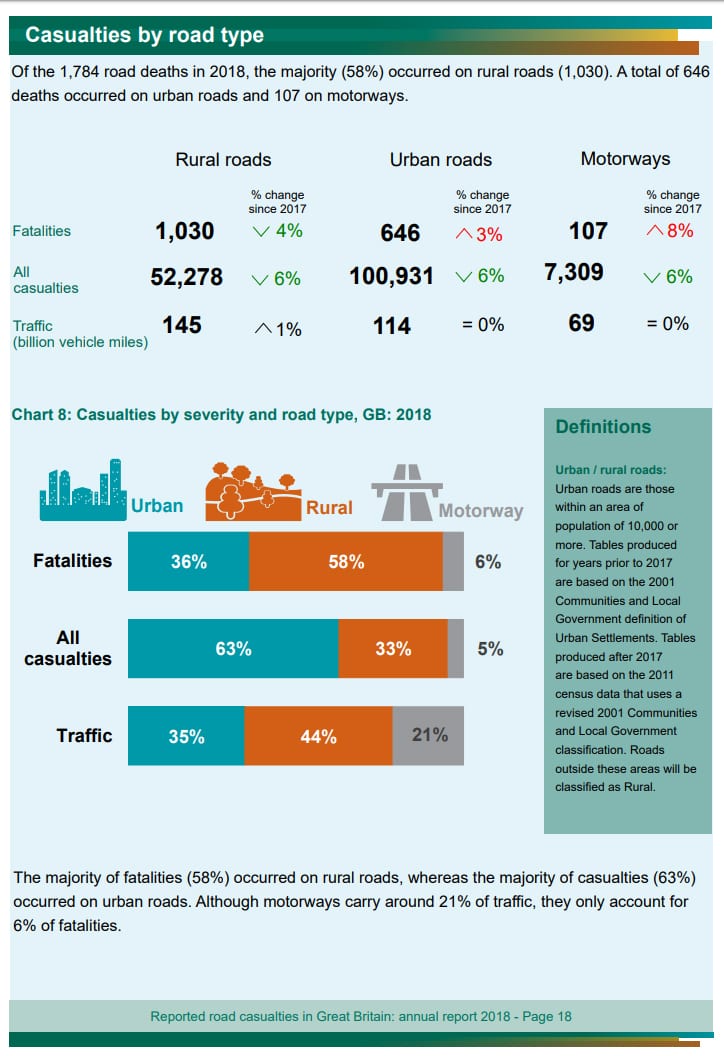
Official statistics show nearly three in five (58%) of 1,784 road deaths last year occurred on rural roads.
Powys in Wales topped the list of most deadly places to drive, averaging eight fatalities per 100,000 inhabitants a year.
Major cities feature much further down the dangerous driving list, with Leeds averaging 3.2 deaths a year and Sheffield, 2.16.
In comparison, East Lindsey in Lincolnshire averages 7.53 fatalities a year and Perth and Kinross, 7.14.
Department for Transport (DfT) figures spanning five years were analysed in time for Road Safety Week (November 18–24), and highlight the danger of rural accident hotspots.
| Area | Av. annual fatal accidents per 100k people |
|---|---|
| Powys | 8.00 |
| East Lindsey | 7.53 |
| Perth & Kinross | 7.14 |
| Highland | 6.96 |
| Aberdeenshire | 5.43 |
| Cheshire East | 4.31 |
| Northumberland | 4.14 |
| East Riding of Yorkshire | 3.95 |
| Central Bedfordshire | 3.81 |
| Doncaster | 3.48 |
| Cornwall | 3.37 |
| Leeds | 3.20 |
| Cheshire West and Cheshire | 3.17 |
| Shropshire | 3.08 |
| Wiltshire | 3.07 |
| Sheffield | 2.16 |
| County Durham | 2.06 |
| Manchester | 2.02 |
| Birmingham | 1.82 |
Over a third of fatalities over the period (646) occurred on urban roads, while the remaining 6% (107) were the result of crashes on motorways.
Almost two thirds (63%) of accidents leading to any type of injury took place on urban roads; 33% on rural roads, the remaining 5% on motorways.
The analysis was made by fuel and lubricant supplier Crown Oil. Project manager, Dave Webb said: ”The figures are frightening and highlight the importance of taking care on the roads, especially as we head into winter.”

A formula where fatalities over five years were also considered by length of road, give results for the UK’s deadliest roads.
The 10-mile A61 in Barnsley emerges as the most dangerous per kilometre stretch with 20 deaths – working out at 0.4 per 100km.
| Road | Fatal accidents per 100km |
|---|---|
| A61 | 0.40 |
| A31 | 0.12 |
| A1(M) | 0.11 |
| A20 | 0.07 |
| A13 | 0.06 |
| A505 | 0.05 |
| A2 | 0.05 |
| A3 | 0.05 |
| M40 | 0.04 |
| A4 | 0.04 |
| A10 | 0.04 |
| A6 | 0.03 |
| A50 | 0.03 |
| A12 | 0.03 |
| A35 | 0.03 |
| A52 | 0.03 |
| M4 | 0.03 |
| A15 | 0.03 |
| A49 | 0.03 |
| A57 | 0.03 |
- Driving without insurance – your FAQs answered
- The top 10 most dangerous and challenging roads in the world
Annual fatality figures have remained around 1,700 over the past five years – a 30% drop compared to 2008.
The government report says there is “no single underlying factor that drives road casualties” but points to a combination of influences, including the distance people travel, the mix of transport modes used and the behaviour of drivers, riders and pedestrians.
The number of total annual accidents has steadily decreased over the past five years from 146,332 in 2014 to 122,635 in 2018 - a difference of -16%.
Do you live in one of the accident hotspots above? Do you think more needs to be done for road safety? Share your thoughts below.
5 Star Defaqto rated cover
RAC Comprehensive Car Insurance Plus has been given a 5 Star Rating by Defaqto. Get a quote online today.


